Export Snapshot from Grafana Dashboard UI 在 Grafana 界面上导出 從 Grafana 介面上匯出
Supported on Chrome, Edge and Firefox browsers, requires Grafana v6.0+
适用于 Chrome / Edge / Firefox 浏览器,要求 Grafana v6.0 或以上
適用於 Chrome / Edge / Firefox 瀏覽器,要求 Grafana v6.0 或以上
-
Copied! 已复制! 已複製!
-
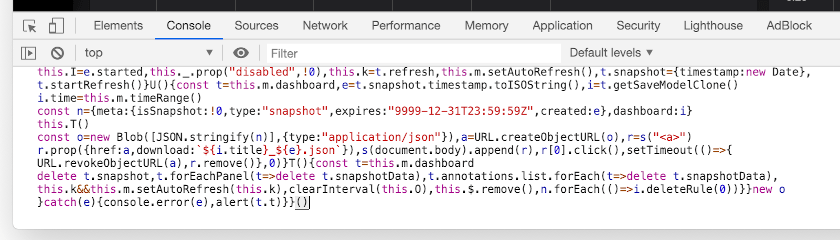
After opening a Grafana Dashboard, press F12 the launch the Developer Tool, and then paste the script in the “Console” tab.
在 Grafana 监控面板中按下 F12 启动开发者工具,在 “Console” 面板下粘贴脚本。
在 Grafana 儀表板中按下 F12 啟動開發者工具,在「Console」頁下貼上指令碼。
-
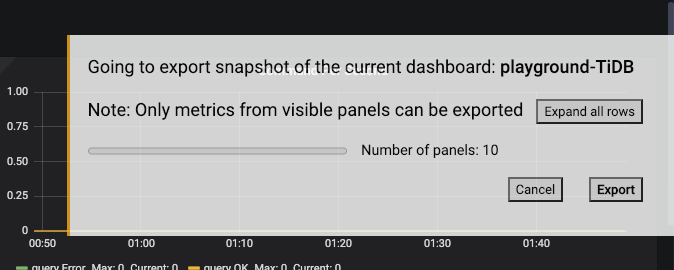
Press Enter to execute the script. A dialog should now appear on the web page. Follow its instruction to continue.
按下 回车 (Enter) 执行脚本。此时 Grafana 网页中会出现操作提示框,请遵循其指示进行后续操作。
按下 輸入 (Enter) 運行指令碼。此時 Grafana 網面中會出現操作提示框,請遵循其指示繼續操作。
↑ Return 返回 返回 // ↓ Extract Local Snapshot 手动取出本地快照 手動取出本地快照
Extract Local Snapshot 手动取出本地快照 手動取出本地快照
Suitable when the browser or Grafana version is too old
浏览器或 Grafana 版本太低时适用
瀏覽器或 Grafana 版本太低時適用
-
After opening a Grafana Dashboard, expand rows which need to exported, or press d then Shift+E to expand all rows (only visible panels are exported).
在 Grafana 监控中展开需要汇出的面板,或按 d 然后 Shift+E 展开所有面板(只有显示的面板才会被保存)。
在 Grafana 儀表板中展開需要匯出的面板,或按 d 然後 Shift+E 展開所有面板(只有顯示的面板才會被儲存)。
-
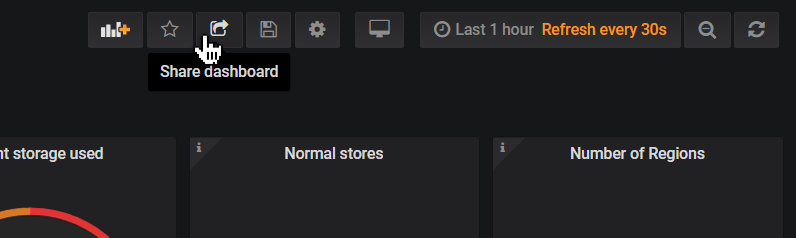
Click the “Share dashboard” button in the toolbar, then “Snapshot”, and finally “Local snapshot”.
点击工具列中的 “Share dashboard” 按钮,然后选 “Snapshot”,最后点 “Local snapshot” 按钮。
點一下工具欄中的「Share dashboard」按鈕,然後選「Snapshot」,最後點一下「Local snapshot」按鈕。
- Right click and save this link: 右键保存这个连接: 右鍵儲存這個連結: 💡 Paste the snapshot link to above first 请先把快取连接贴到上面 請先把快取連結貼到上面
Import Grafana Snapshot File with cURL or Wget 使用 cURL 或 Wget 导入 Grafana 快照文件 使用 cURL 或 Wget 匯入 Grafana 快照檔案
Suitable when there is an existing Grafana instance, cURL or Wget is accessible, but third-party software cannot be used.
适用于已有现成的 Grafana 实例,可执行 cURL 或 Wget,但不方便下载第三方软件。
適用於已有現成的 Grafana 實例,可運行 cURL 或 Wget,但不方便下載第三方軟體。
-
Prepare the Dashboard Snapshort JSON file, and note down the Grafana URL, login name and password.
准备好要导入的监控快照 JSON 文件,以及 Grafana 的地址和登入用户密码。
準備好要匯入的儀表板快照 JSON 檔案,以及 Grafana 的位址和登入用戶密碼。
-
Execute import command:
执行导入:
運行匯入指令:
curl -H 'Content-Type: application/json' 'http://admin:admin@localhost:3000/api/dashboards/import' --data-binary @/root/snap1.jsonin which: 其中参数是: 其中參數是:
- http://admin:admin@localhost:3000
- Login name, password, host and port of Grafana server Grafana 服务器的登入用户名、密码、地址和端口 Grafana 伺服器的登入用戶名稱、密碼、位址和通訊埠
- /root/snap1.json
- Path of the imported JSON file 要导入的 JSON 文件路径 要匯入的 JSON 檔案路徑
-
Output like this is shown after finishing. Open the marked URL to view the imported snapshot.
完成后会打印类似这样的反馈,打开标示出的 URL 即可检视快照。
完成後會輸出類似這樣的結果,開啟標示出的 URL 即可檢視快照。
{"pluginId":"",
 "title":"New Dashboard (exported at 2020-01-01T12:00:00.000Z)","imported":true,
 "importedUri":"db/new-dashboard-exported-at-2020-01-01t12-00-00-000z",
 "importedUrl":"/d/Q6RuHYIWk/new-dashboard-exported-at-2020-01-01t12-00-00-000z",
 "slug":"new-dashboard-exported-at-2020-01-01t12-00-00-000z",
 …}
Import Grafana Snapshot File with “grafsnap” 使用 grafsnap 命令行工具导入 Grafana 快照文件 使用 grafsnap 命令列程式匯入 Grafana 快照檔案
Suitable when there is an existing Grafana instance, and third-party software can be downloaded and run.
适用于已有现成的 Grafana 实例,并且能下载及执行外部命令行工具。
適用於已有現成的 Grafana 實例,並且能下載及運行第三方命令列程式。
Grafana is bundled with tiup playground, so you can quickly start a fresh instance with it if needed. 如果没有现成的 Grafana 实例,可以使用 tiup playground 快速起一个。 如果沒有現成的 Grafana 實例,可以使用 tiup playground 快速啟動一個。
-
Download 下载 下載 grafsnap 0.1.0 and extract it into the current folder. 压缩包并解压到当前目录。 壓縮檔並解壓縮到當前目錄。
wget https://github.com/kennytm/grafana-export/releases/download/v0.1.0/grafsnap-0.1.0-linux-x86_64.tar.gz tar xfv grafsnap-0.1.0-linux-x86_64.tar.gz -
Prepare the Dashboard Snapshort JSON file.
准备好要导入的监控快照 JSON 文件。
準備好要匯入的儀表板快照 JSON 檔案。
-
Execute import command:
执行导入:
運行匯入指令:
./grafsnap import -b 'http://localhost:3000/' -k 'admin:admin' ~/snap1.json ~/snap2.jsonin which: 其中参数是: 其中參數是:
- -b 'http://localhost:3000/'
- Host and port of Grafana server Grafana 服务器的地址和端口 Grafana 伺服器的位址和通訊埠
- -k 'admin:admin'
- Login name and password; you can also use an API Key 登入用户名和密码;亦可以使用 API Key 登入用戶名稱和密碼;亦可以使用 API Key
- ~/snap1.json ~/snap2.json
- Paths of the (multiple) imported JSON files 要导入的 JSON 文件路径,可一次导入多个 要匯入的 JSON 檔案路徑,可一次匯入多個
-
Output like this is shown after finishing. Open each URL to view the corresponding snapshot.
完成后会打印类似这样的反馈,打开列出的 URL 即可检视对应的快照。
完成後會輸出類似這樣的結果,開啟列出的 URL 即可檢視對應的快照。
[
    {
        "file": "snap1.json",
        "url": "http://localhost:3000/dashboard/snapshot/94prEd89WqqawEJkujYit5aHHkqbkKWs"
    },
    {
        "file": "snap2.json",
        "url": "http://localhost:3000/dashboard/snapshot/b4wJAg4OQ9t6yTddpawF6cImiG2MVpt2"
    }
]